Simple Monitoring via New Relic Synthetics
Your own watchbot
There is a whole suite of testing tools available for your apps being developed internally. Uptime monitoring services are also plentiful, but one quick, cheap & easy way to get notified when there’s something wrong with one of your sites is via New Relic Synthetics!
We won’t go into the nitty gritty of getting a monitor set up, it’s all well written here in New Relic’s documentation of it all. The very basic of which is Ping, and more importantly the only monitor that New Relic offers on their free tier.
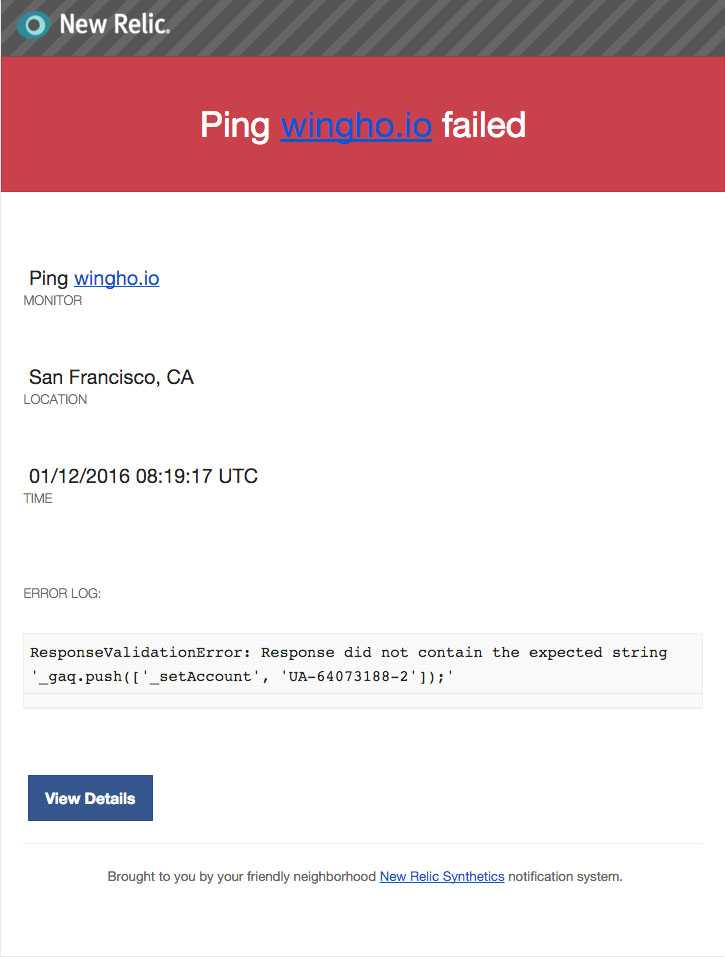
So go into Synthetics and set up a basic ping monitor for each of your sites, and as a bonus, if you have say your Google Analytics script inlined, you can also check for that via Synthetics. You can just throw in the whole part into the “Add a validation string to look for in the response (optional)” field.
_gaq.push(['_setAccount', 'UA-XXXXXXXX-Y']);
Alternatively if you’re loading scripts via Google Tag Manager you could go for this, depending on how it’s formatted on your page:
<noscript><iframe src="//www.googletagmanager.com/ns.html?id=GTM-XXXXXX></noscript>
You can also check for some elements on your page, for example if you had a h1 tag that you needed to stay consistent, you could fill in:
<h1>Tell Me When You Can't Find This</h1>
If you wanted to check for multiple scenarios of above, you can always set up additional monitors for them. Another reason for adding a check for an element on your website’s page is a failsafe against your site having some sort of database issue sneaking through the monitor in the form of a white or blank page.
The most important thing is to ensure you fill in an email to send notifications to if the monitor fails. Then you can get on top of whatever the issue is as soon as it’s detected. This check is a set and forget (until you receive a failure notification email!) so it’s a no brainer use this if you ever need some more automation in your developer workflow.
